Science in Your Watershed
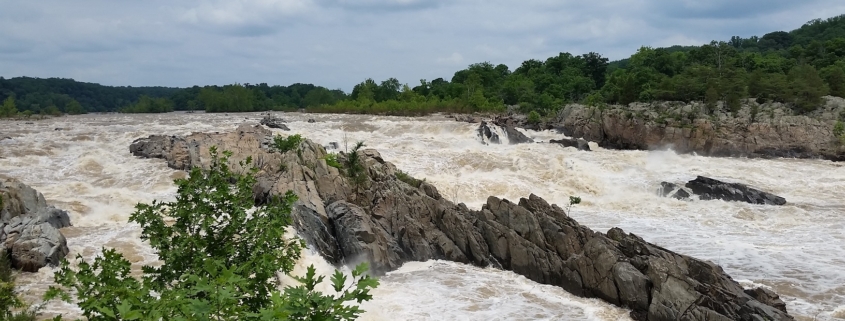
Feature photo: The Mighty Potomac on June 2, 2018
Article, photo and images provided by FMN Stephen Tzikas
A watershed is a common geographic area that drains all streams and rivers into a common outlet, like a bay. The Northern Virginia Soil and Water Conservation District has a macroinvertebrate stream monitoring program that helps protect our watersheds:
https://www.fairfaxcounty.gov/soil-water-conservation/volunteer-stream-monitoring
Getting to know your watershed is like getting to know your neighborhood. Our local Potomac Watershed is part of the Chesapeake Watershed, which is part of the Mid-Atlantic Watershed, and which is part of the Eastern Watershed. A principal river of a basin is a river that drains directly into the ocean. Our Atlantic Seaboard Basin includes the Hudson River, Delaware River, Susquehanna River, our local Potomac River, and the Savannah River. Your watershed’s information can be found at this USGS website which contains many USGS links:
https://water.usgs.gov/wsc/map_index.html
You can visit the Environmental Protection Agency (EPA) website, type in your zip code, and get a local map of your watershed: https://www.epa.gov/waterdata/hows-my-waterway. For example, my Reston home location is part of the local Difficult Run watershed.
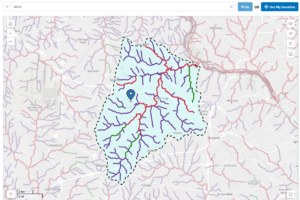
Illustration by author: Local Watershed Generated by the EPA website per input of the 20191 zip code. Notice the drainage pattern. Depending on a location’s geology, drainage patterns can be dendritic, trellis-like, rectangular, or radial.
The website provides physical, chemical and biological water quality factors from its monitoring locations. In Fairfax County, drinking water comes from two major sources: the Occoquan Reservoir and Potomac River. Fairfax Water operates both the Corbalis and Griffith treatment plants, where water undergoes a series of treatments. In recent years, new emerging contaminants have become a concern in drinking water. You can help protect the drinking water quality in Fairfax County by preventing water pollution and reducing runoff. For example, don’t flush expired pharmaceuticals in the toilet, and keep car wash suds out of the storm drains.
By visiting the USGS water data website, more interesting data can be gleaned: https://waterdata.usgs.gov. I used this site to compare historical information to an unusually high level of water in the Potomac River following a large rain event. The unusual event took place on June 2, 2018, the day I took a geological excursion to Great Falls Park with Northern Virginia Community College (NVCC).
The flux of the Potomac River on June 2, 2018 was 25,000 cubic feet per second as recorded at Little Falls dam and pumping station. River flux is controlled both by precipitation and the size of the watershed. Flux affects erosion rates. When a path of a river narrows the velocity rises, and there is more erosion by 3 types of stream loads. Dissolved load is comprised of invisible minerals carried to the ocean, where through evaporation and concentration, the ocean receives its high salt content. The suspended load carries the coarser sands and requires a faster velocity. The competence of a river is the maximum particle size that it can transport, and the thalweg is the line of lowest elevation within a watercourse. As one walks toward a thalweg, the brushing of sand particles upon the leg will be stronger. The bed load rolls along a river bottom, and these carry the largest and heaviest materials. The Appalachian Mountains feed these three loads through erosion.
The mountains now average about 3,500 feet in height, but were up to 20,000 feet at peak height some 200-300+ million years (Myr) ago. These higher mountains had a steeper gradient 100 Myr ago. The velocity was higher, as well as cut down, and so too the erosion. As a river cuts down, mass wasting can fill in through rock falls on the sides. In 100 Myr the Potomac River will be flatter and wider with a lower gradient. This is compounded by rising sea levels by melting polar region ice. During the entire time of our NVCC geologic hike through Great Falls Park we did not change elevation. But there was a cut down from upstream (where we stood on the shoreline) to downstream of the river (where it was a gorge). Another type of river dynamic is headward erosion. Downstream waterfalls push rocks off causing the waterfall to slowly move upstream. In floods the competency goes down and larger particles settle as the river covers a wider area.
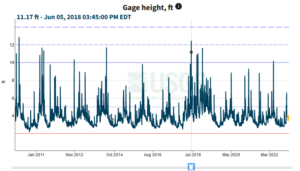
Pro Illustration extracted by author: Gage Height Potomac on June 2, 2018. This illustration shows the gage height during the heavy water flows on June 2, 2018. Date marked by blue square.
Also visit the National Water Dashboard link at https://waterdata.usgs.gov and go to Potomac River near Washington, DC Little
Falls Pump Station, by zooming in on the map. Select that pump station and click the site page link on that new page. Find the legacy real-time page link and select it. At this link location one can search on specific parameters, such as gage height, for a date rage. Gage height is the height of the water in the stream above a reference point. Notice how large Gage Height was on June 2, 2018 during my geological excursion.