Izaak Walton says, Watch your Salt!
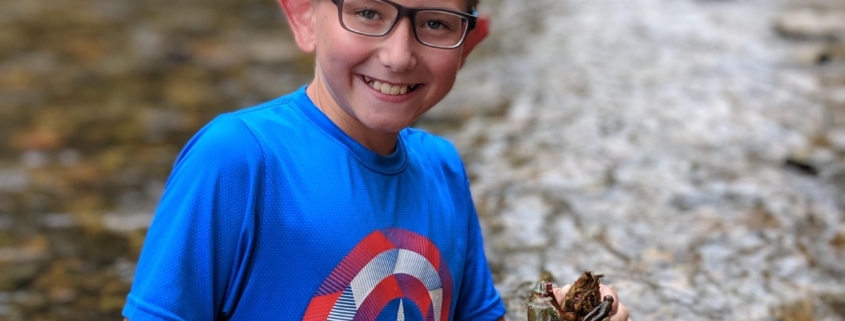
Article and photos by FMN Bill Hafker
Last fall I was looking for some environmentally beneficial things to do as winter approached and the usual opportunities were dwindling. Then I spotted information about the Izaak Walton League’s (IWL) Salt Watch program. I was aware of the serious negative impacts that road salt can have on roadside vegetation, and more so on the aquatic systems that receive the runoff. With IWL supplying the needed test strips by mail, and their phone app used to upload the data, this seemed to be an easy way to make a meaningful contribution.
I did a bit more research on salt usage and was surprised to learn that if we think we use a lot of salt in our foods, we actually use over 10 times more on our roads annually. Doctors are starting to worry that road salt getting into drinking water could affect people with high blood pressure. Most freshwater fish cannot adapt to salt in water, and it can also be harmful to macroinvertebrates and other food sources for fish, birds and other species that forage in impacted waters. Chloride levels over 100ppm exceed natural background concentrations, with prolonged exposures over 230ppm being toxic to freshwater aquatic life.
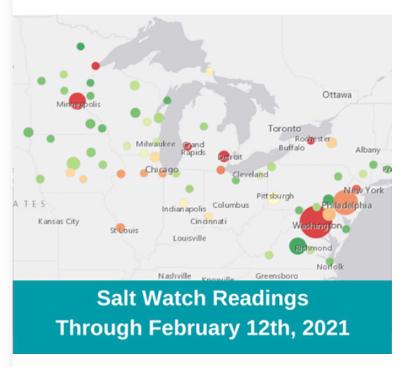
Last winter, 222 Salt Watch results were submitted for the D.C., Maryland and Virginia area. 18% were above 100ppm, and 6% were above 230ppm. It may be that there were relatively few samples submitted and high readings found, since we had a relatively mild and snow-free winter.
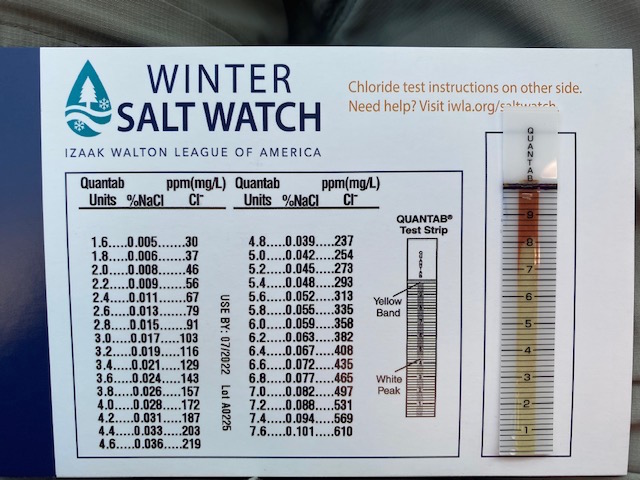
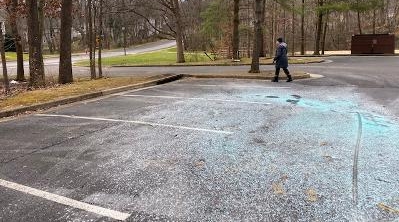
Welcome 2020/21. Snow and ice returned and I got a chance to get out for some before and after testing. I went to two streams near roads I know are salted, with a small cup in hand, to collect a half-inch of water. I did get some curious looks from passing drivers as I dipped my glass into the stream and started heading off to my car with it. After putting the IWL test strip in the cup for about 5 minutes, I took a picture of the strip on the calibration card provided, and uploaded it to the IWL Water Reporter App. Process complete!
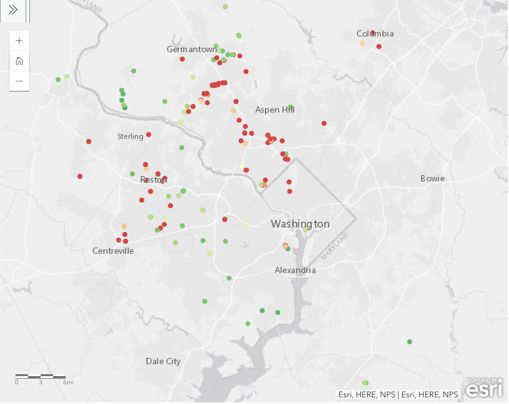
The results were concerning, and seemed to mirror what others were finding around Fairfax this year (see chart). Of the five pairs of readings I took, the baselines were at or below 50ppm, except in one case where the readings before and after a snow event were both over 600ppm. In the other cases, two stayed at ~50ppm, one went up to ~100ppm, but in the final case it went to over 400ppm.
I was curious about what the salt impact on some nearby ponds/lakes might be. The two I tested registered below 50ppm. Finally, I wondered how salty our tap water, which comes from the Potomac, might be, and was surprised that it had a 1.2 reading, which was higher than one of the lakes I tested.
Once you get outside and start looking around, it’s surprising what you can find in addition to what you are looking for. Last fall I participated in the FMN education and field opportunities related to invasive water chestnut in local water bodies. At one of the ponds I tested in Oakton, I was distressed to find the banks covered with the seeds of water chestnuts. I don’t know if this infestation was already known, but I was able to report this finding to the USGS invasive species reporting website and to the researcher who taught us about this.
It’s fun to be able to find a meaningful activity that gives me an excuse to get out into the field at a time when most folks don’t get out. The extra solitude and peacefulness actually makes this a wonderful time to do meaningful citizen science. The data collected makes it possible to identify chloride hot spots and assess the impacts of the salting practices of various jurisdictions. This allows researchers to assess possible impacts on affected environments, and policy makers and transportation department managers to evaluate salting options. IWL’s Salt Watch is the only place where volunteer chloride data is collected on a national scale.
If this appeals to you, please put a tickler in your calendar for next October/November to contact IWL about Salt Watch, get your test kits, and get out and get your feet wet. And keep an eye on your salt!
https://www.iwla.org/water/stream-monitoring/winter-salt-watch
[Ed. Note: The Washington Post’s John Kelly recently reported on IWL’s Salt Watch: A clean water group wants us to give the cold shoulder to excessive road salt}